Recently I’ve presented some ideas on the complex interrelation between energy, society, and innovation. As you might have expected, the textual description of that topic is complex as well; hence I’ve worked on some simple charts to support the overall storyline.
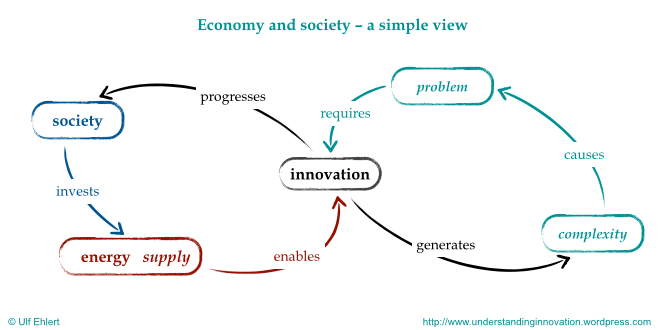
A first simple overview could look like two cycles connected through innovation. On the left, you’ll find that society provides the energy that enables the pull-through of innovative ideas, which then contribute to social development. That is quite desirable, but let’s not forget the second cycle on the right: a problem calls for an innovative solution, which generates complexity that in turn causes further problems. While the left cycle might seem like a virtuous circle, the right cycle is almost vicious. Could that be realistic? I guess you’ll share the inkling that this presentation might be a bit too simple. In fact it’s missing a number of important considerations: it is not very precise about the role of energy, and there’s no indication of any constraints or limits to these cycles.

Hence I’d suggest an alternative, more inclusive presentation, again based on two cycles connected through innovation. Here, the cycle at the top is shaped by society’s continued need and desire for solutions to emerging problems. While innovation is intended to solve problems, this depiction does acknowledge the collateral effect that innovation itself can generate new problems.
The cycle at the bottom is framed by the undesired outcome of innovation, the collateral increase in complexity, and the energy cost for that. It’s important to note the separation of energy supply and energy demand, as that is essential to understand the constraints within all these cycles. Starting from energy supply, there’s quite some similarity with the simple depiction above: energy supply enables the pull-through of innovative ideas, which has the collateral effect of increasing complexity. And with growing complexity you’ll find a growing energy demand. At the same time, the available energy supply poses a constraint on complexity, i.e., on the level of complexity that this society can sustain.
In the end, only the combination of the simple and the more inclusive perspective can give us a comprehensive view. And that then is a little more complex than the initial simple view.

These charts give a better overview of the sometimes tricky interactions between what we want (problems solved) and what we get (yet more problems). They show the connections between what we understand intuitively, that it takes energy to solve problems; and what is difficult to grasp, energy poses a limitation to our problem-solving capacity. In the previous post I’ve suggested three avenues to overcome that capacity limitation, hence I’ll come up with some more (simple) charts to depict those proposed innovation avenues. Stay tuned …
